Last year was a big year for data science on GOV.UK, as we formed GOV.UK Data Labs and deployed our first machine learning model to production. This model automatically recommends content to users on the site based on which page they are on - quite similar to how you might get recommended a new show to watch on your favourite streaming app.
In order to train our model of choice, the node embedding algorithm node2vec, we needed to represent our user journey data on GOV.UK as a graph; with the pages as nodes and the user movement as edges (where weights are the popularity of the journey). Node2vec, given any graph, learns continuous feature representations (a vector of numbers) for the nodes, which can then be used for various machine learning tasks, such as recommending content.
Through this process, we learned that creating the necessary data infrastructure which underpins the training and deployment of a model is the most time-consuming part. Famously, data scientists spend most of their time finding and cleaning their data! Having to work with graph representations led us to wonder how we could store and reuse such data in the future.
How the GOV.UK Knowledge Graph helped our work
To give you the short version - here are a few goals our Data Labs team had, along with how the GOV.UK Knowledge Graph (govGraph) has helped us achieve them:
- explore graph databases and knowledge graphs for GOV.UK applications
- collaborate with other teams and communities to help them find content more easily
- build products and apps that allow further insights about our content such as the journey visualisation app
- upskill colleagues and drive culture change to make better use of data and improve data literacy in GOV.UK
- provide early adopters with access and training to help scale use of our data apps and product - if there’s buy-in then it makes things simpler based on feedback.
Graphs are everywhere
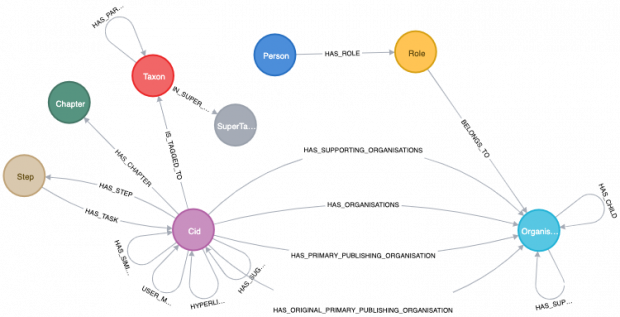
Graph representations enable us to infer new relationships and patterns within our data that we might not have spotted otherwise, ultimately leveraging our data to help users; Google’s knowledge graph is an example. The first step is storing this data to power other potential apps, by setting up a graph database. For discovery, we’re using Neo4j, which our team has previous experience with.
Initially, we experimented with representing user journey data in our graph and then added other, previously siloed, data sources, which limited the impact and depth of our analytical insights. We started to include additional GOV.UK page information, such as the page title, body text and document type (you can access this data for yourself using the GOV.UK content API). In the context of a graph, all of the above metadata was added as node properties.
At that point, we had the early makings of a knowledge graph; a rich, canonical source of data that brings together datasets from across GOV.UK and the wider world. We’ve been calling this data product “govGraph”.
Data transformation in an organisation
GovGraph has been useful for the GOV.UK Data Labs team in powering several apps. Since one of our team’s goals is to “build products that allow our colleagues to gain further insight into our users and our content”, we have released a prototype for discovery to the rest of the GOV.UK team.
Throughout the graph-building phase, we have aimed to improve the graph’s functionality not only for analytical purposes, but also so that it could solve automatable, repetitive tasks across different professional communities.
For example, finding pages that reference a set of keywords or phrases is a very common problem for content designers and it has historically been quite time-consuming. With help from our developers, the knowledge graph now gets automatically built every day and is hosted on an AWS instance. Our colleagues can connect and ask content-related questions, using the Cypher query language, like “return all the content that mentions hauliers”. We can even assign labels based on results, speeding up future queries.
For example, we created a “COVID_19” label for relevant COVID-19 content. This allowed us to quickly ask questions like “return all the COVID-19 content that has been owned and updated by Her Majesty's Revenue and Customs (HMRC) after March 1st”. This ease of querying has facilitated self-service, democratising data access.
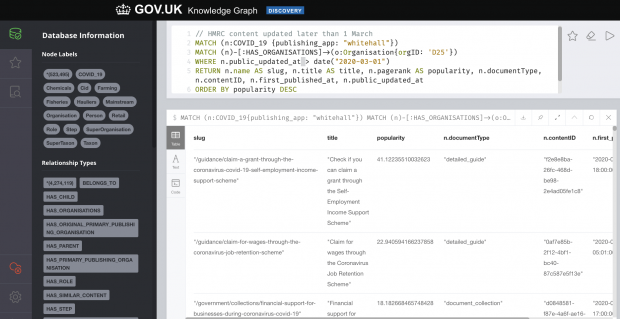
We take a toy example to demonstrate the flexibility of govGraph. Our query above, in the upper box, asks for (MATCH) all the COVID-19 content nodes (pages that contain the words “coronavirus” or “covid-19”) published with the “Whitehall” app. We then filter these nodes WHERE content is associated with HMRC and that has been updated after March 1st. We can then sort by “popularity” to help us prioritise our work; this is useful as it’s not always obvious what the most important content is to those who aren’t domain experts. To create a popularity score, we use PageRank.
PageRank is an algorithm that measures the transitive influence or connectivity of nodes. It counts the number and quality of links to a page which determines an estimation of how important the page is. The underlying assumption is that pages of importance are more likely to receive a higher volume of links from other pages. We use a modified version that also considers the weight of links to and from a page. The weighted PageRank by user sessions on a page enriches govGraph with user analytics data.
The query returns a priority-sorted list that can be actioned. GovGraph reduces the amount of time our colleagues spend creating lists of things by getting a machine to do the boring work. Our colleagues can then add value elsewhere by reviewing the content and updating or improving it for our users.
Working towards the future
Our efforts so far have focused on infrastructure and cultivating community interest as well as support. We have mostly achieved this by solving “quick win” business problems.
Simply providing access to the govGraph, without the necessary infrastructure to support non-technical colleagues, was not something we wanted to do as an organisation. We wanted to ensure that our data would be usable and accessible by everyone. We needed to do the hard work to make using it simple.
Our first aim was to get some govGraph champions within the content design community. We did this by showcasing prototypes at their community meet-ups, and based on their feedback we wrote tutorials and documentation to help them easily write their own queries for their most common use cases. This fostered enthusiasm and they are now running their own workshops.
The govGraph’s agility came in handy when our performance analysts (PA) needed to quickly attach short-lived labels to some of our content. Our PAs were keen to identify content relevant to some industry groups on GOV.UK, such as hauliers and farmers. Using some regular expressions (text pattern matching), we identified this content using govGraph. The added bonus was that this labelling would cope with any content changes or newly published content as govGraph is built daily. This provided PAs with a canonical data source that automatically stayed up-to-date.
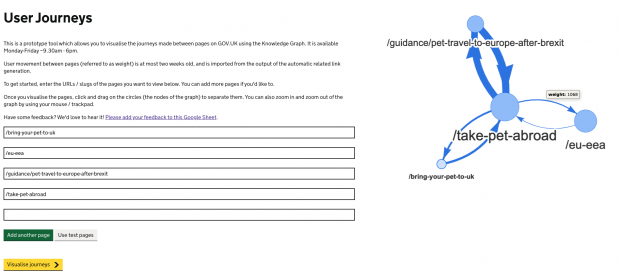
Finally, we built a simple prototype to show the popularity of connections between GOV.UK pages to help address the problem of identifying how users are moving about a specific neighbourhood of content. This uses govGraph and the Neovis.js library to visualise movement between specified pages and has helped content designers discover how users are navigating to and from these pages, enabling them to tailor content to meet the audience’s needs and signpost to other related content. The diameter of the nodes is proportional to the PageRank of each page within the GOV.UK functional network and the width of each edge is proportional to the number of users moving between those pages.
What’s next?
We are currently expanding our knowledge graph by introducing “real-world” things and concepts into it: things like a “passport” or the concept of “being a student”. Working within the field of Natural Language Processing and focusing on entity recognition and linking, we are trawling our text to detect and extract such mentions. By capturing and formalising the “real-world” impact content has for people, we’re paving the way for a more personalised GOV.UK.
This aligns with the future vision of GOV.UK, where we want to improve personalisation on the site and help users identify content relevant to life events like “having a baby” or “starting a business”.
GOV.UK Data Labs tells the story of the Discovery phase of building a Knowledge graph, which we call govGraph. This graph representation of GOV.UK content and its relationships to other government ‘things’ has powered apps and insights. We are now leveraging Natural Language Processing to enrich the graph further.
We would love to hear from people who have worked in this space!