We blogged about our plans for HMRC manuals many months ago, and since then we’ve spoken to more users of the manuals and made minor changes to our designs. Now we’ve started work to put one full manual online in beta to gather feedback about how easy it is to use, and to improve our design before we put all the HMRC manuals onto GOV.UK.
We chose the Employment Income manual for our beta, because it's a representative manual in terms of size and complexity. It’s also one of the most popular, with around 4.8 million pageviews a week, so it should be easy to get a robust dataset for analytics and to recruit users for lab testing.
As our product team began exploring the Employment Income manual, we found it has a more complex structure than we'd originally thought. With over 3000 pages - some containing content, some just listing other pages - it was too laborious to analyse by hand. So to help us understand the data structure, we decided to scrape the information from the HMRC website and graph it.
The result was the graph below. Each page is represented by a node with a blue circle and a reference number, eg EIM24000. The pages link to each other approximately in a tree structure, and these relationships are shown by the grey lines. If a page only lists pages that contain content, it's placed at the far right (since our design collapses the bottom 2 levels of content).
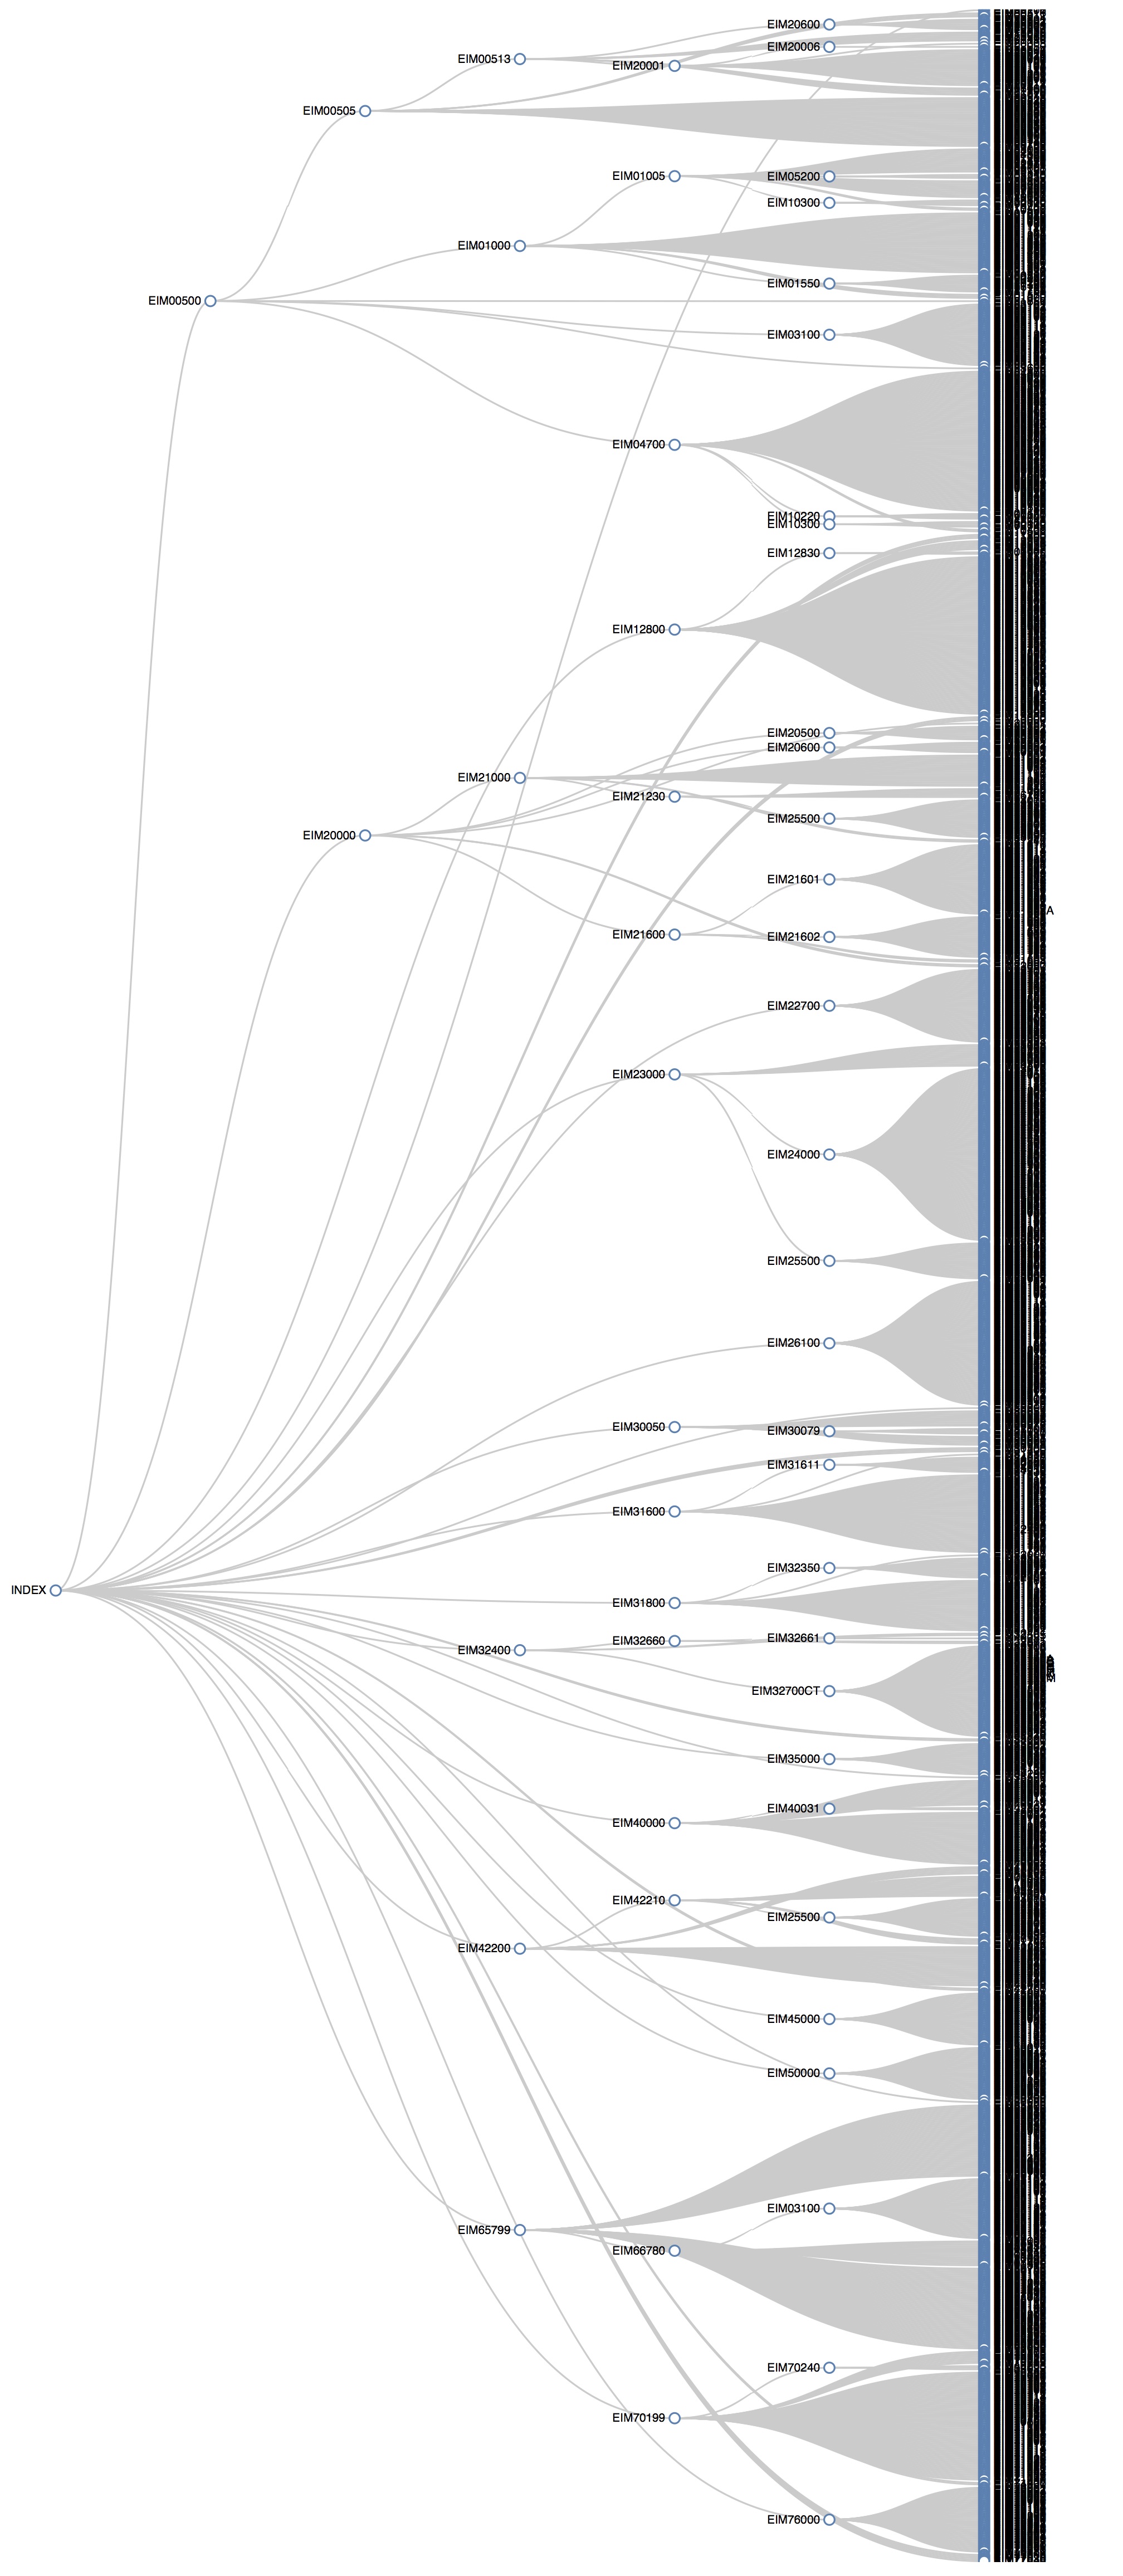
Graphing this content taught us a number of useful things.
1. The manual is divided into sections that are between 1 and 7 layers deep.
2. We started with 2 designs for the manuals: sections with content and sections with lists of further sections (‘child’ sections). However, we found that some pages have both content and child sections, eg EIM11200, so we have adapted our designs to support this.
3. The relationships between sections are not strictly hierarchical: some sections link sideways or even backwards (these circular references have been removed in this version of the diagram for clarity). This is mainly because of linking to related sections.
4. In a small number of cases sections of the manual are used as flowcharts, with letters at the end of reference number indicating which stage of the flowchart you are in, eg EIM32730a and EIM32730b.
Armed with this new knowledge, we are making progress with building the beta. We’ll write about it as soon as it goes live.
