The information in this blogpost may now be out of date. See the current GOV.UK content and publishing guidance.
Tables in HTML publications can now be made into barcharts automatically.
These charts follow style guide recommendations and are accessible to users with screenreaders. Users who would prefer just to read the table can press to switch between the table and the bar chart view. Before this change, you had to make charts yourself and include them as images.
You can create stacked or grouped barcharts. To make them, create a table, and include ‘{barchart}’ after the table. Always add a blank line before your table, and after the “{barchart}” line.
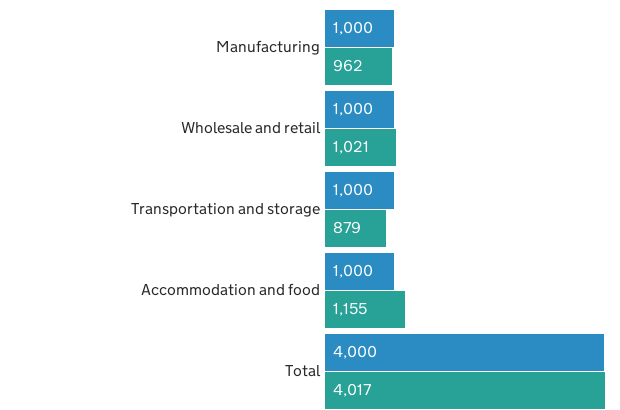
| Sector                     | Target Interviews | Achieved Interviews |
|----------------------------|-------------------|---------------------|
| Manufacturing              | 1,000             | 962                 |
| Wholesale and retail       | 1,000             | 1,021               |
| Transportation and storage | 1,000             | 879                 |
| Accommodation and food     | 1,000             | 1,155               |
| Total                      | 4,000             | 4,017               |
{barchart}
To make a stacked barchart, add a ‘Total’ column and use “{barchart stacked}”.
If your barchart includes negative numbers then add the word ‘negative’. For example, “{barchart negative}” or “{barchart stacked negative}”. Finally, if a chart takes up too much space, add the word ‘compact’. For example “{barchart compact}”.
Future improvements will also allow you to preview charts (currently you have to publish the document to see them). We’d like feedback on what would be useful to you.

8 comments
Comment by Julia posted on
Looks good, but your worked example hasn't transferred the headings - so if you just see the bar chart, how do you know what the blue and green bars relate to?
Comment by Elliot Hughes posted on
Hi Julia, You're completely right. The actual bar charts have a key just above them explaining the colours. The example has been cropped down a bit, so the key is missing.
Comment by Alan posted on
Looks interesting, is it available in preview please?
Comment by Alice Newton posted on
Yes it is now available in preview - with details of how to use in the formatting support side-bar.
Comment by Alan posted on
Thanks
Comment by Matt posted on
Are there any plans to add Information Box markup to HTML publications, as per Mainstream pages?
In general HTML publications are much longer than Mainstream pages so the need to be able to highlight some key bits is probably greater.
Comment by Alice Newton posted on
Hi Matt,
We already have the ability to highlight key bits in HTML publications, using the 'call to action' markup. In the formatting help menu, you'll be able to find an example of how to use this.
Thanks,
Alice
Comment by Alan posted on
Our statisticians are interested in this feature and had a couple of comments. The first was on whether an axis could be added and secondly whether the display could be vertical as well as horizontal?
On tables in general, would it be possible to align figures to the centre or right or provide the option to do so please?