We posted last month (‘1 in 5 visits is from a mobile’) about the growth in traffic from mobile and tablet devices.
We’ve started looking at how these devices are used through the day and for what they are used for.
24-hour access
Looking at users arriving on GOV.UK, desktops (that includes most laptops) still dominate. But their use strongly correlates to the working day - 9am to 5pm. Desktop users tail off in the evenings while mobile use stays steady and tablet use grows.

Device use through the day
We can look at the data in a different way. If we set aside the different volumes of traffic these devices bring we see that the pattern of use of different devices varies through the day. The chart below shows how tablets are most used in the evenings.
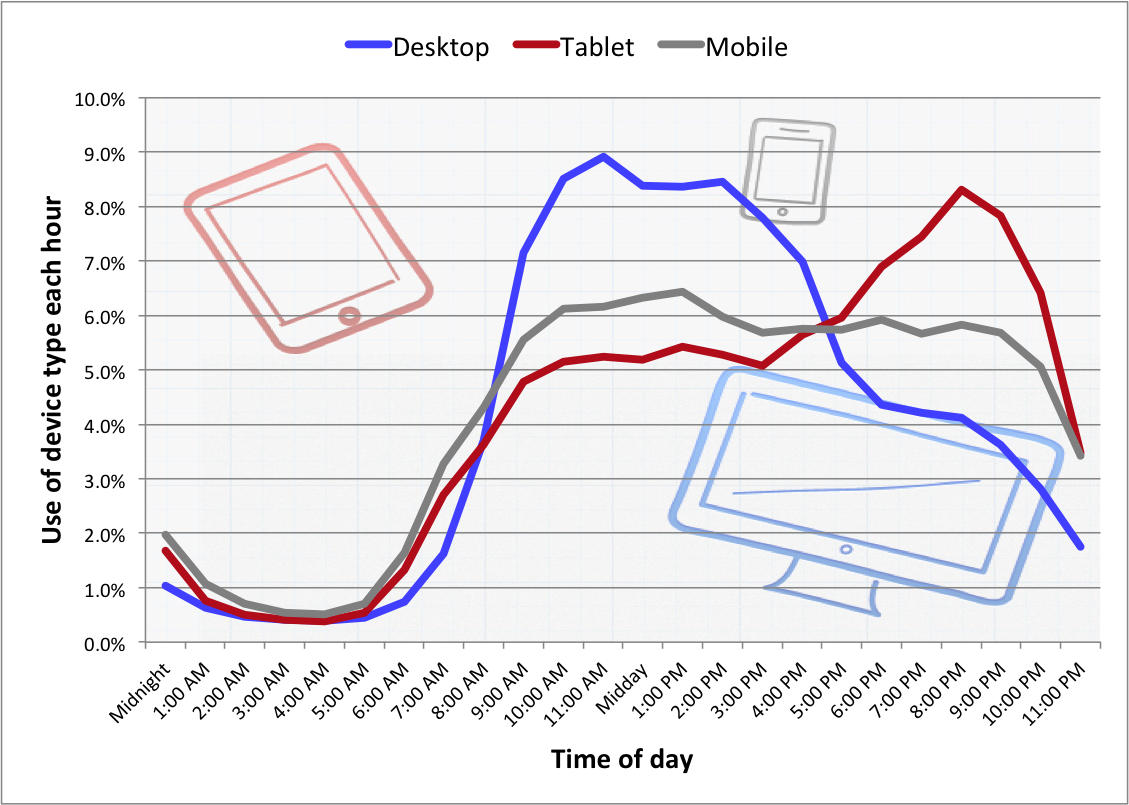
These usage patterns of different devices replicate what others have reported; for example Comscore and Econsultancy.
Weekends
There’s a weekend difference too. In the last 6 weeks 71% of weekday users access GOV.UK on their desktop PCs. That falls to 60% at the weekend.
At the moment the only times that mobile and tablet traffic to GOV.UK actually exceeds desktop traffic is at the weekend: for a couple of hours after midnight and at 7 and 8am in the morning.
Differences in use
It’s also possible to see differences in the types of content these devices are used to access.
People seem to be more likely to use their mobile to look up the location of an office or check simple dates like bank holidays or the end of Summertime. They are far less likely to use mobile to read detailed guidance or to search on the site. None of this is particularly surprising.
Other differences need to be interpreted carefully. So we seem to find that mobile and tablets are used far less frequently than desktops for accessing business content or searching for trade tariffs. But that probably reflects the context of its use. This content is mainly accessed during the working day and by businesses where desktops proliferate.
Currently we’re looking at this data at a site level. We think there are some rich opportunities to work with user research and design colleagues to understand use of different formats on different devices.
 The GOV.UK app went live in public beta in July 2025. Find out what’s been happening, and what’s coming next,
2 comments
Comment by Alison Turnock posted on
your percentage chart doesn't make sense. What are they percentages of? Why don't they add up to 100?
Comment by Paul Cronk posted on
The chart is not directly comparing device type usage in traffic terms. It looks at how different types are used through a day. So about 8% of tablet accesses take place 8-9pm while just 4% of desktop accesses happen then. 100% comes from summing hourly accesses for a particular device.
Desktops are still dominate in getting users to the site, but I'm looking at how devices get used through the day.
Yes, the chart could have been clearer.