Performance analysts are at the heart of helping GDS digital teams understand user needs. But we’ve become increasingly aware of the user needs in the rest of government for data, analysis and reporting.
We’ve been working to support these needs for a while by:
- running regular Show and Tell events, inviting colleagues outside GDS to share their work and learn best practice
- providing training, support and bespoke analysis to meet specific needs
- launching 37 new content analytics dashboards onto the Performance Platform, which give departments and some large agencies a high level view of how their content is performing
But we know some departments and agencies feel frustrated or have particular needs, so there’s still more for us to do.
Workshop
So, recently, we ran a user needs workshop with over 20 colleagues from across government. We asked them to think about their own needs as well as their stakeholders’ needs for data and insights that they can act on.
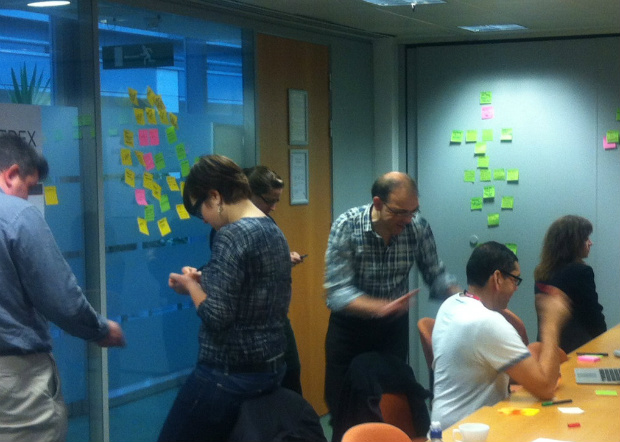
We held 3 interactive sessions to give us a better understanding of our users, their needs, and the tools we currently use to access analytics data.
1. Who are our users?
We discovered a rich diversity of users who need data and insights:
- digital teams, including content designers, user researchers and digital champions
- the general public and specialists audiences such as academics, journalists and funders
- marketing and communications colleagues, including press officers, campaign managers and agency media planners and buyers
- other colleagues within the organisation, including policy and professional specialists, service and product managers and digital engagement teams
- more senior staff we report up to, including Ministers, MPs and digital leaders
2. What are our users’ needs?
We were pleased to see that users need data and insights they can act on. They want to find out:
- why content is ‘working’ or ‘not working’
- if user journeys from GOV.UK content to a service work well
- the effectiveness of campaigns
- baseline data so they can measure improvements
- the level of brand awareness
- about topical and trending interest
- trends on channels, devices, times of day, periods of the year
- how findable their content is
- about referrals
- how many downloads
- high level trends
- manage data quality and releases
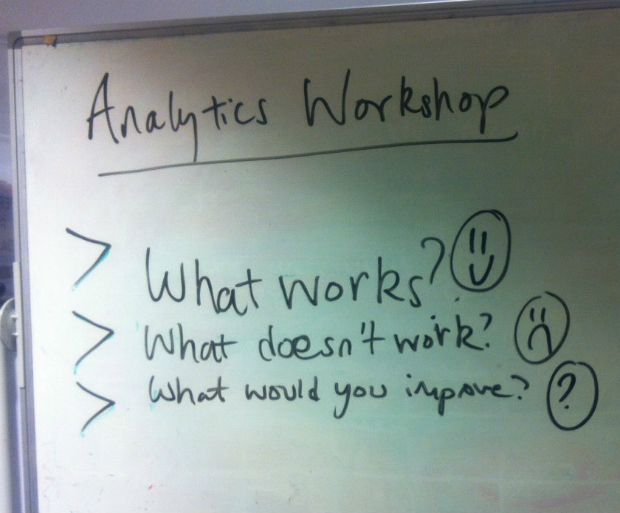
3. Current tools for accessing analytics data
We reviewed a range of tools and reports that are currently available to colleagues doing analysis and what 'worked' or didn't 'work'?
Email alerts
Email alerts are automated, accessible and regular, but not everyone is aware of them.
Analysis community
The analytics community is useful for sharing knowledge, networking and holding Show and Tells. Again, though, not everyone is aware of the community.
Training
Training could be more regular and used to share more best practice. It would be good if it was available remotely.
Analytics dashboards
Analytics dashboards are sharable and can be tailored and annotated. More widgets would be good, but it was questioned if they meet a user need.
Blogs
Although blogs are interesting and get good feedback, it was felt there are too many and they can be hard to find again. Their value was questioned by some.
Analytics user interface
The analytics user interface is a quick and powerful tool. However, it’s complicated, the terminology isn’t clear and it’s not clear when sampling gets invoked.
Info pages
Although info pages were thought to be a great concept, allowing you to see the purpose of each page, they lack context and normalisation.
Feedex
Feedex is simple to use but only being able to view 1 URL at a time is restrictive. Making it easier to share comments would be helpful.
Magic Script/Google Sheets Add-on
Magic Script/Google Sheets Add-on gives people direct access to data and is repeatable, but not everyone is aware of it or has access to Google docs.
Data visualisation tools
Data visualisation tools are a useful and powerful way to tell stories but can be hard work to set up and raise privacy concerns.
Next steps
We’ll use additional feedback from departments and agencies and user research on the Performance Platform dashboards to write stories which we’ll share again for feedback.
We’ll use these to:
- help GDS analysts plan the use of enhanced analytics features
- provide feedback to GOV.UK to inform product development and especially its tagging strategy
- help us plan how GDS supports departments and agencies with data and analysis (eg community of practice, practical training, finding the right balance between various tools)
You may also be interested in: