
Felisia Loukou, Data Scientist

One graph to rule them all

Posted by: and , Posted on: - Categories: Data
A visual representation of the GOV.UK knowledge graph. It shows a simple graph schema consisting of nodes, represented by coloured circles, and edges, represented by directed arrows. It shows some of the main entity types in the graph. Cid stands for content id, and can be thought of as a piece of content on GOV.UK. Also present are organisations, people and roles. More important are the relationships between entities, including some machine learning derived features such as HAS_SIMILAR_CONTENT_TO which uses the cosine similarity of 'content embeddings' to compute how similar they are to one another.

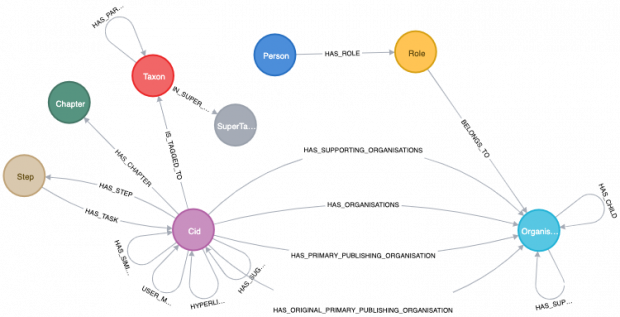
GOV.UK Data Labs tells the story of the Discovery phase of building a Knowledge graph, which we call govGraph. This graph representation of GOV.UK content and its relationships to other government ‘things’ has powered apps and insights. We are now leveraging Natural Language Processing to enrich the graph further.