This clinic was a little different from previous ones. There was a lot to show so there were more presentations than usual. Visualising publications data Ashraf Chohan showed visualisations of data about how many publication content items are published and …
We recently blogged about using Tableau to visualise how 'departments and policy' content is being viewed on GOV.UK based on data for May.
We're using a new data visualisation tool called Tableau to reveal new information on how 'departments and policy' content is being viewed on GOV.UK. The GDS departments and policy content team currently uses Google Analytics to track how content is viewed and the effects of …
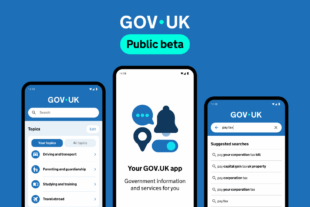 The GOV.UK app went live in public beta in July 2025. Find out what’s been happening, and what’s coming next,