Michael Lyons, a content designer at Defra, writes about finding a workaround for splitting tables containing multiple links in Whitehall Publisher.
Creating tables in Whitehall Publisher can, initially at least, be vexing. Particularly as the markdown is (understandably) designed to render only simple grids.
But, with a little creativity and patience, this format can be used to display information simply and clearly.
When I built my first table in Whitehall Publisher, as part of Defra’s content transition to GOV.UK, I needed to present a basic, 2-variable matrix.

But when I needed to replicate a table like this one, containing several links to PDFs in each cell, I discovered the limitations of Whitehall. At first I assumed I could put each PDF link on a separate line within the cell. I tried both hard and soft carriage returns. Neither worked. In fact it takes an HTML hack to force it.
This was a frustrating limitation. I considered running the PDFs in-line, one after the other in each cell. But visually, this gave a poor result:
Splitting the tables
It looked like my only option was to have a new row for every PDF link – which would result in a table with around 14 rows.
This would mean the user would have to scroll down so far that the headers would disappear through the top of the screen, making the cell contents meaningless and creating a poor user experience.
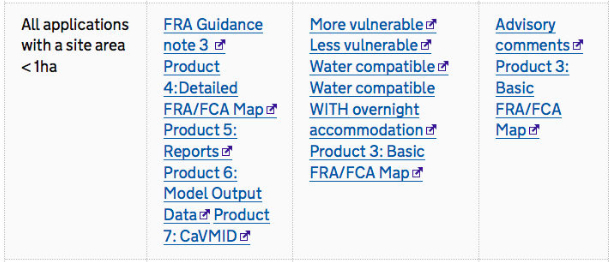
I then discovered that I could split the single table into 3 tables, each with the headers repeated, so that it was clear what each cell’s content related to.
You can see the finished table on this flooding guidance page.
Creating a table in Whitehall Publisher
The character for creating tables using markdown in Whitehall is the vertical bar. It looks like this: | (On a Mac keyboard, it’s Shift + ).
To make a table you must make sure there are the same number of vertical bars in every line of text, with a carriage return at the end of each line.
2 vertical bars will form a column in your finished table:
| cell text |
A line translates into a row.
It might be useful to cut and paste the template text below, add your text, then add or delete columns and rows as necessary. Experiment in Preview to test out different templates.
| column 1 header text | column 2 header text | column 3 header text | column 4 header text |
|--------|-------|--------|-------|
| cell text | cell text | cell text | cell text |
| cell text | cell text | cell text | cell text |
| cell text | cell text | cell text | cell text |
| cell text | cell text | cell text | cell text |
(The row with the dashes is important as it applies a tint to the row directly above it.)
As always, experimenting with different arrangements is the fastest way to see what works and what doesn’t.
Read more about creating tables in the GOV.UK publisher manual.

2 comments
Comment by Jeni Pitkin posted on
Hi Michael,
Thank you for sharing your working! This is useful.
Can Government Digital Services confirm whether it is acceptable to use tables not just for data but for formatting other content too. For Word documents the style guide says 'Don’t use tables to make cosmetic changes to the layout of the document'. I thought this might be the case for HTML content too?
Thanks,
Jeni
Comment by Michael Williams posted on
Are you sure a table is the best way of presenting this information? A simpler, clearer and faster approach might use headings and a bulleted list of links –
##Applications with a site area < 1ha
###Flood zone 3
* first link
* second link
* etc
###Flood zone 2
* first link
* second link
* etc
A screen reader will read the rows in sequence but most users will be interested in the links in a particular column. Even sighted users might be misled into thinking that all the cells in a particular row have relation to each other but not to cells in other rows.
WebAim has useful information about accessible tables – http://webaim.org/techniques/tables/